

Logs
Logs list every tool call made to your MCP server: which tool was invoked, when, by what source, whether it succeeded, and how long it took. Unlike debug sessions, which capture a live trace for a limited window, logs keep a persistent history of your server’s activity so you can monitor usage and investigate issues after the fact.
Logs can be found in your MCP server settings.
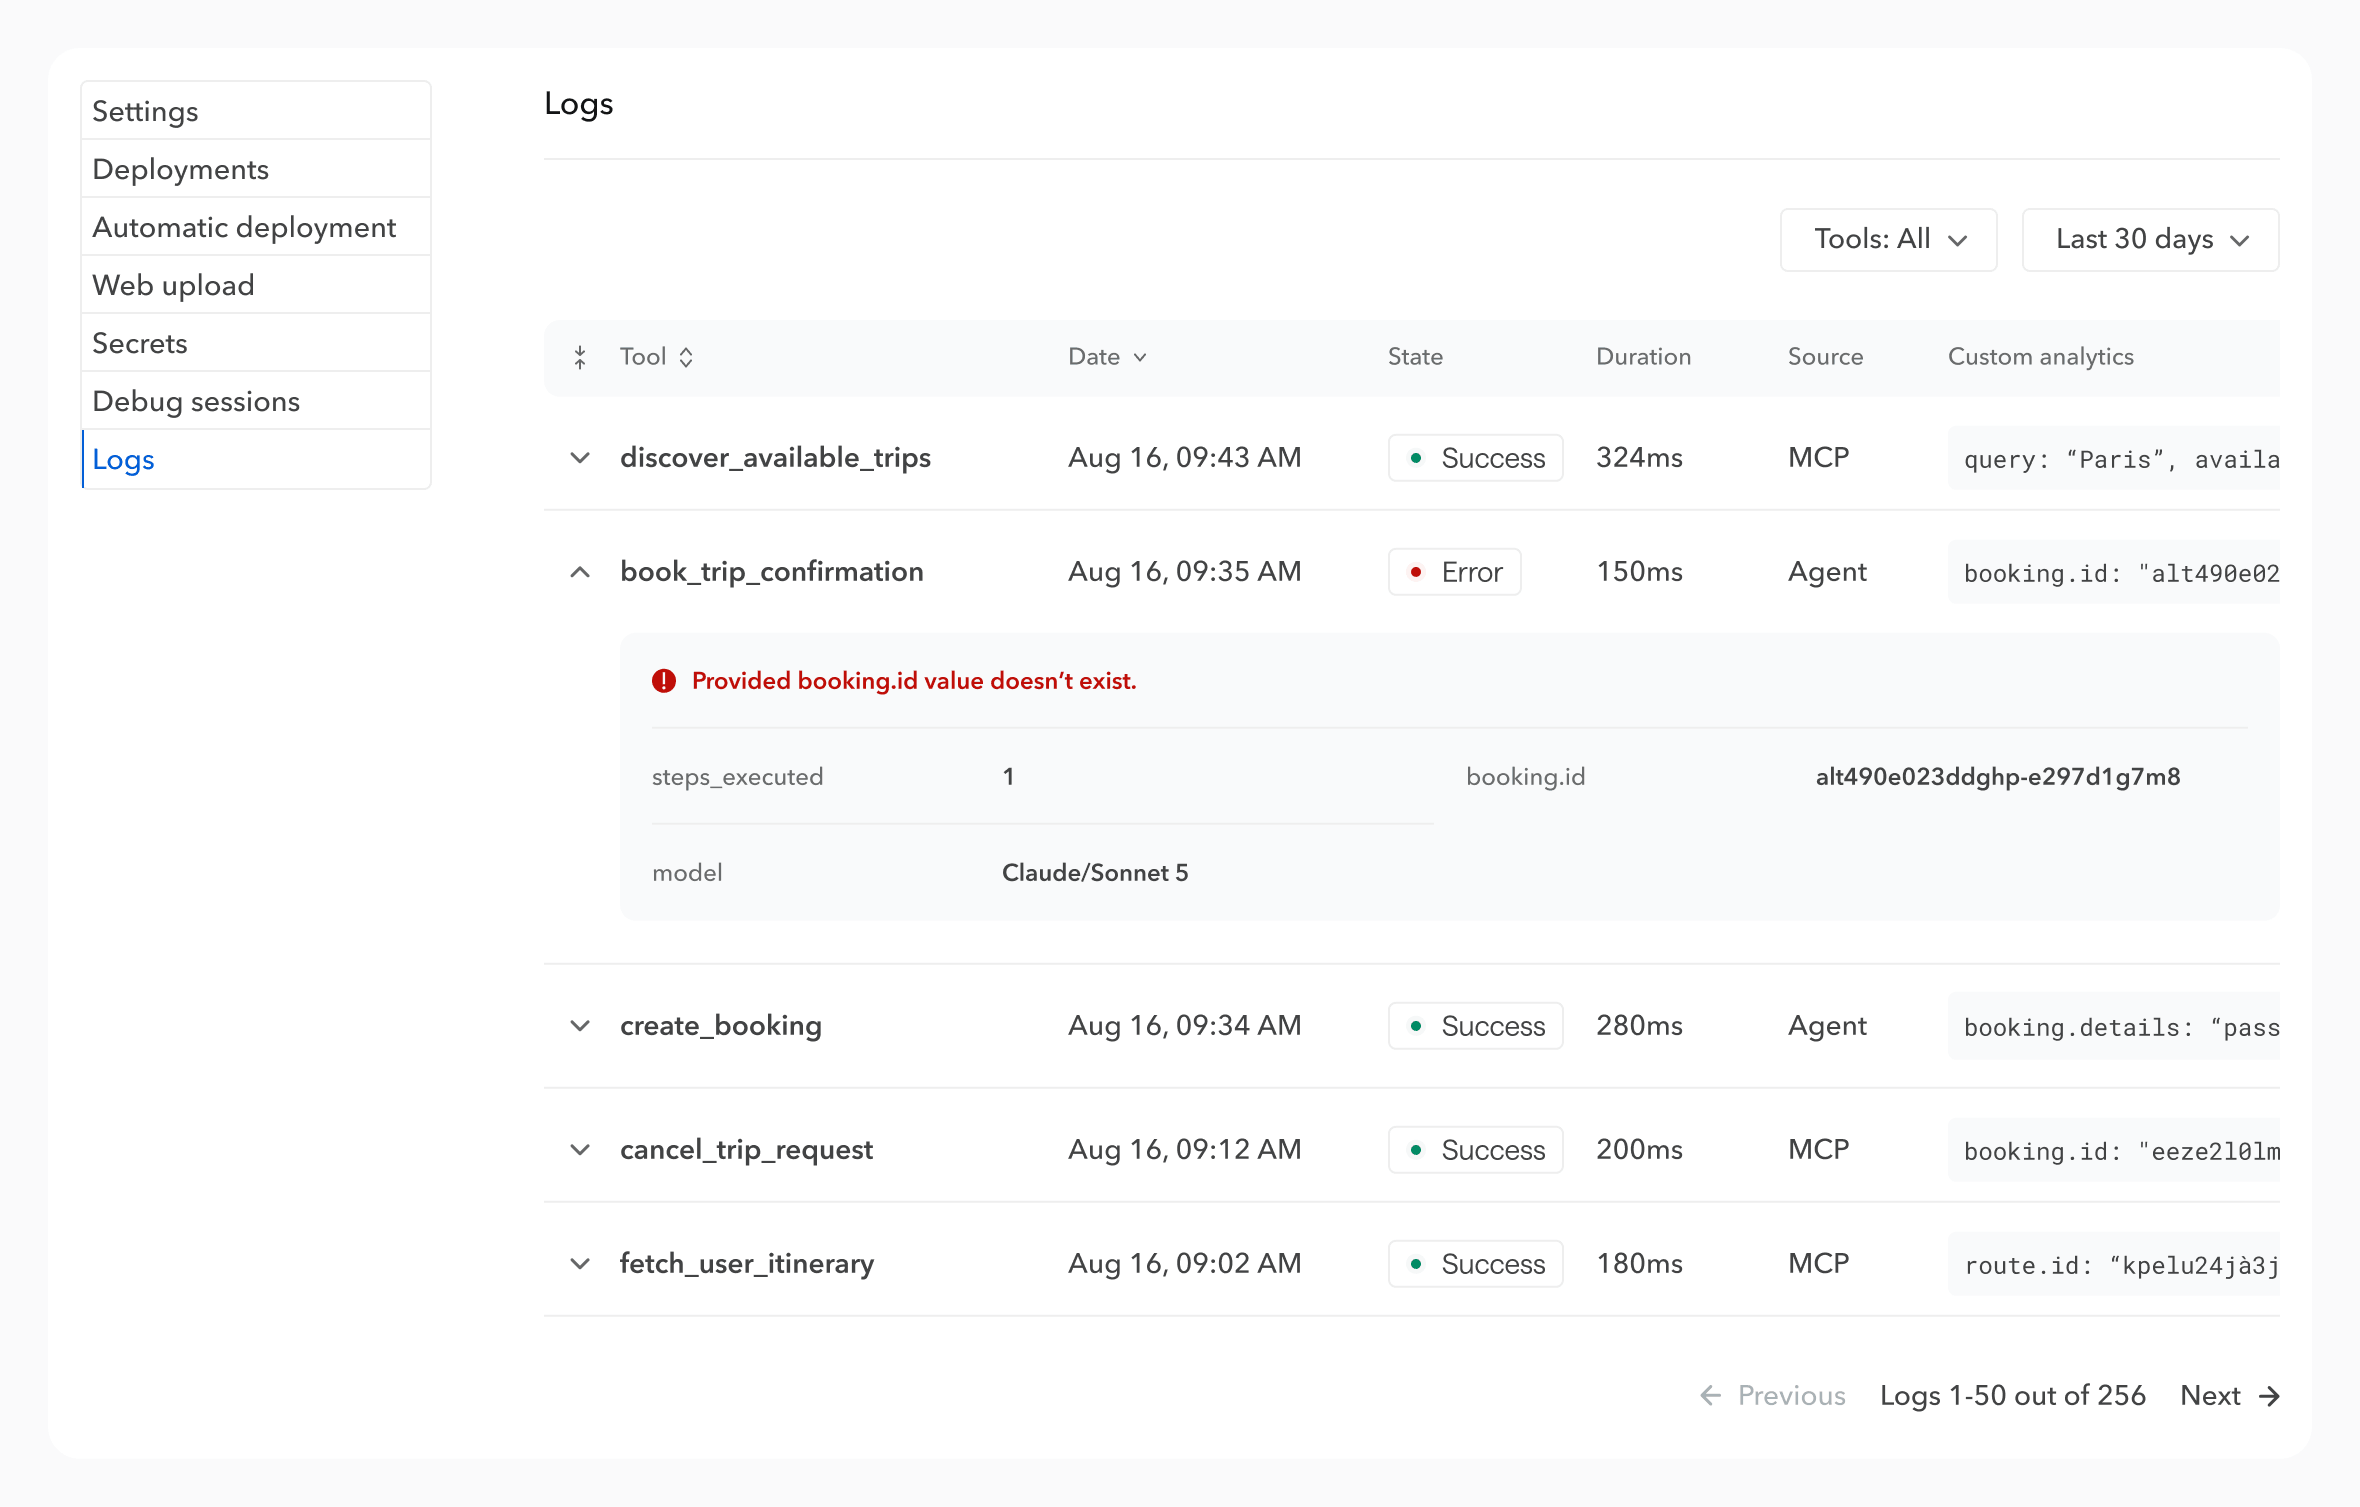
Read the logs table #
Each row is one tool call, with the following columns:
- Tool: the name of the tool invoked, matching a flow
idin your workflow document. - Date: when the tool was called.
- State:
SuccessorError. Error details can be found by clicking on a row. - Duration: execution time of the tool.
- Source: where the call came from.
MCP: the tool was called through the MCP server by an AI tool connected over the MCP protocol (Claude, Cursor, ChatGPT, etc.).Agent: the tool was called through the agent endpoint.
- Custom analytics: any data you chose to surface for that tool by defining
analyticsin your workflow document. See Custom analytics below.
You can click on a specific log to get more information about its run.
Custom analytics #
By default, logs tell you that a tool ran and whether it succeeded, but not what it actually did. Custom analytics let you surface any part of a tool’s execution, so you can inspect the values that mattered for a given tool call, without opening a debug session.
Define them with the analytics property on a flow, using runtime expressions to reference inputs, step outputs, config values, or anything else available during execution:
flows:
  - id: book_trip_confirmation
    # ...
    analytics:
      booking.id: $steps.create_booking.outputs.id
      booking.details: $steps.create_booking.outputs.details
Each key becomes a value in the Custom analytics column for that tool’s log entries.
Only authentication data (
$secrets,$current_user.token) are always excluded from analytics. Everything else you reference is logged as-is, so avoid surfacing values that may contain personal data or other sensitive content.
Edit this page on GitHubSee the Flower specification for the full
analyticsreference.